PDF
Laboratory report
PDF · 2.7 MB
Using tracer motion to see the structure of a flow.
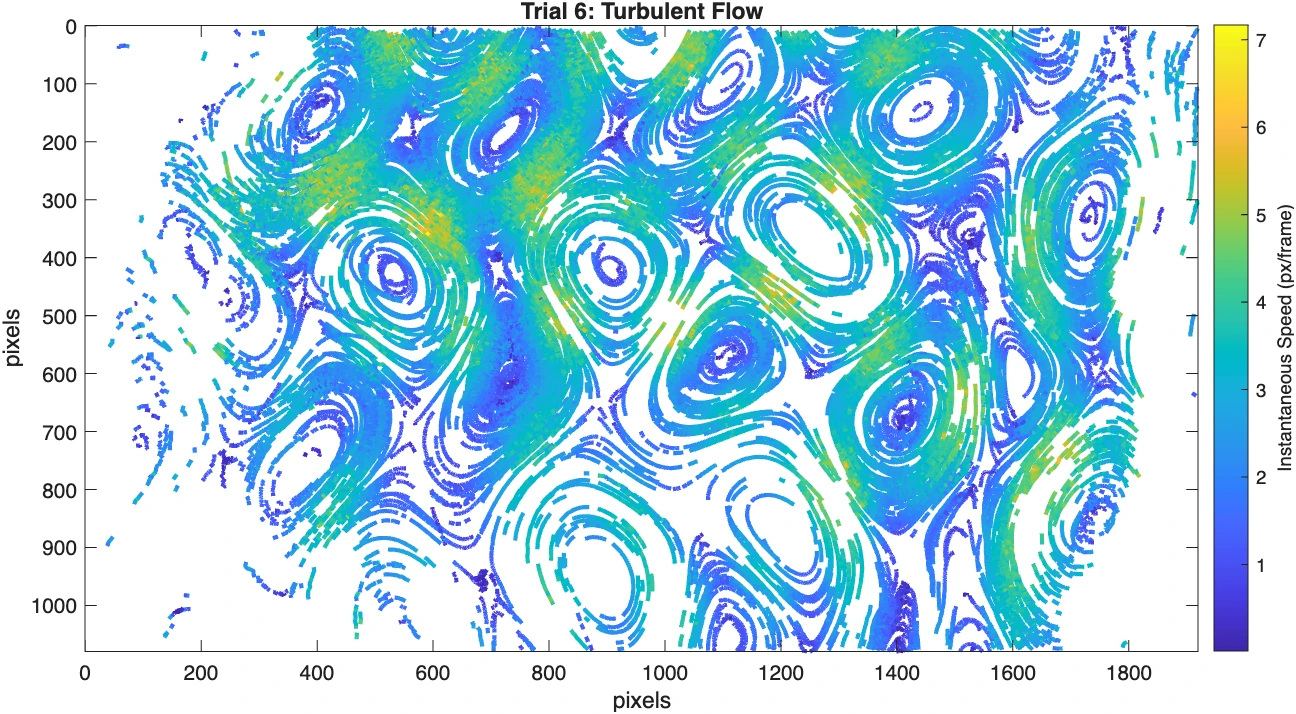
Tracer-flow imagery from the particle-tracking report.
An optical particle-tracking laboratory investigating motion in a fluid. Recorded tracer trajectories and MATLAB analysis reveal the difference between shear-band behavior and vortical flow.
This was a collaborative ME 240 lab. The portfolio presents the experimental observations and analysis documented in the team report.
The report identifies a transition near a Reynolds number of 24.0 in the experimental apparatus. This is a result for the laboratory conditions, rather than a universal transition criterion.
Tracer trajectories turn an otherwise difficult-to-see flow into measurable evidence. Image quality and interpretation remain central to the reliability of the analysis.